 |
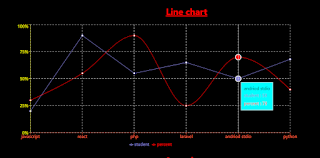
| line chart web developer joy |
 |
| area chart web developer joy |
 |
| bar chart web developer joy |
 |
| pie chart web developer joy |
copy this code and paste your src folder app.js
source code =>>
import {
ResponsiveContainer,
Line,
LineChart,
XAxis,
YAxis,
CartesianGrid,
Tooltip,
Legend,
AreaChart,
Area,
BarChart,
Bar,
PieChart,
Pie,
} from "recharts";
const data = [
{
name: "javascript",
student: 20,
percent: 30,
},
{
name: "react",
student: 90,
percent: 55,
},
{
name: "php",
student: 55,
percent: 90,
},
{
name: "laravel",
student: 65,
percent: 25,
},
{
name: "andriod stdio",
student: 50,
percent: 70,
},
{
name: "python",
student: 68,
percent: 40,
},
];
function App() {
return (
<>
<h1
style={{
textAlign: "center",
textDecoration: "underline",
color: "red",
}}
>
Line chart
</h1>
<ResponsiveContainer width="100%" aspect="3">
<LineChart
data={data}
width={200}
height={300}
margin={{ top: 5, right: 300, bottom: 5, left: 50 }}
>
<Line dataKey="student" stroke="#8884d8" activeDot={{ r: 10 }} />
<Line
dataKey="percent"
type="monotone"
stroke="red"
activeDot={{ r: 10 }}
/>
<XAxis dataKey="name" interval={"preserveStartEnd"} stroke="tomato" />
<YAxis
dataKey="percent"
stroke="yellow"
tickFormatter={(value) => value + "%"}
/>
<Legend />
<CartesianGrid strokeDasharray="5 5" />
<Tooltip contentStyle={{ backgroundColor: "cyan" }} />
</LineChart>
</ResponsiveContainer>
<h1
style={{
textAlign: "center",
textDecoration: "underline",
color: "red",
}}
>
Area chart
</h1>
<ResponsiveContainer width="100%" aspect="3">
<AreaChart
data={data}
width={200}
height={300}
margin={{ top: 5, right: 300, bottom: 5, left: 50 }}
>
<Area dataKey="student" stroke="#8884d8" activeDot={{ r: 10 }} />
<Area
dataKey="percent"
type="monotone"
stroke="red"
activeDot={{ r: 10 }}
/>
<XAxis dataKey="name" interval={"preserveStartEnd"} stroke="tomato" />
<YAxis
dataKey="percent"
stroke="yellow"
tickFormatter={(value) => value + "%"}
/>
<Legend />
<CartesianGrid strokeDasharray="5 5" />
<Tooltip contentStyle={{ backgroundColor: "cyan" }} />
</AreaChart>
</ResponsiveContainer>
<h1
style={{
textAlign: "center",
textDecoration: "underline",
color: "red",
}}
>
Bar chart
</h1>
<ResponsiveContainer width="100%" aspect="3">
<BarChart
data={data}
width={200}
height={300}
margin={{ top: 5, right: 300, bottom: 5, left: 50 }}
>
<CartesianGrid strokeDasharray="2 3" />
<XAxis dataKey="name" stroke="tomato" />
<YAxis dataKey="percent" stroke="yellow" />
<Legend />
<Tooltip contentStyle={{ backgroundColor: "cyan" }} />
<Bar dataKey="student" fill="#8884d8" />
<Bar dataKey="percent" fill="yellow" />
</BarChart>
</ResponsiveContainer>
<h1
style={{
textAlign: "center",
textDecoration: "underline",
color: "red",
}}
>
pie chart
</h1>
<PieChart width={730} height={250}>
<Pie
data={data}
dataKey="student"
nameKey="name"
cx="50%"
cy="50%"
innerRadius={60}
outerRadius={80}
fill="#82ca9d"
label
/>
<Tooltip contentStyle={{ backgroundColor: "cyan" }} />
<Legend />
</PieChart>
</>
);
}
export default App;

owo
ReplyDelete